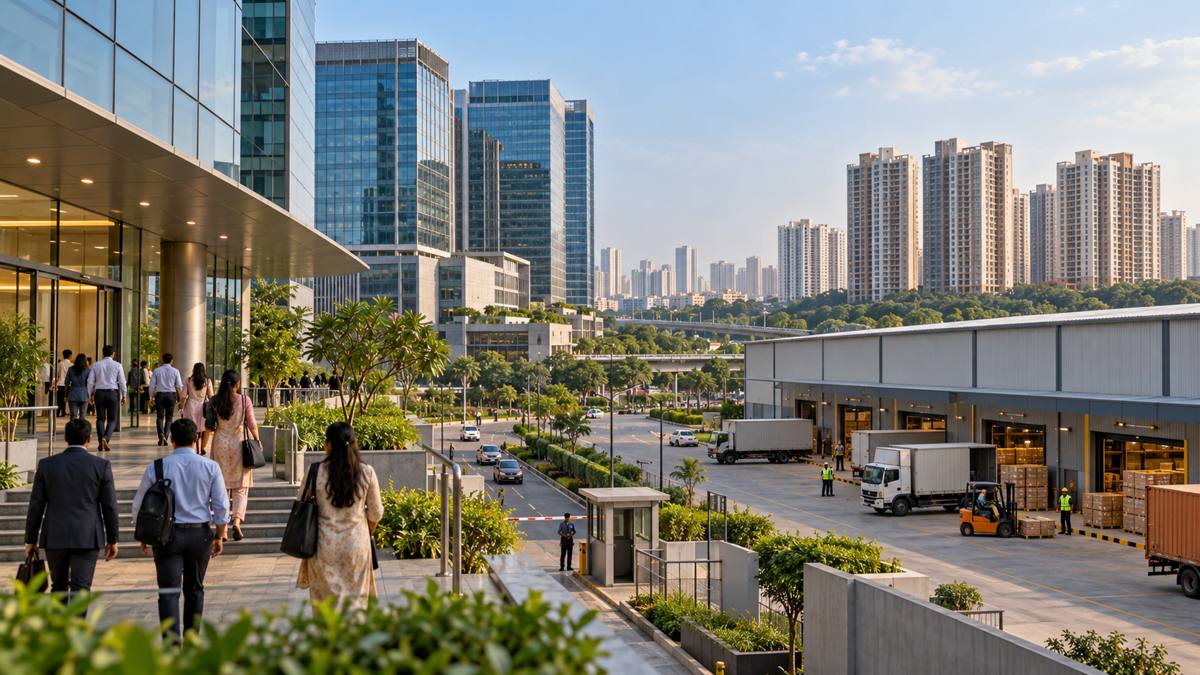
Commercial and residential indicators move differently
India’s commercial real estate market showed continued demand in the first half of 2026 while residential inventory increased, according to coverage of Equirus’s “Real Estate Tracker — Sept 2026” published on 4 October.
The report puts net office absorption across the top seven cities at 27.4 million sq ft in H1 2026, 2% higher than a year earlier. Office completions fell 10% to 22.2 million sq ft, while vacancy declined to a multi-year low of 15%, according to the ANI account carried by The Tribune and Webindia123. [1][2]
These figures concern the first half of 2026, not transactions completed on 4 October. The current development is the publication of coverage about the September tracker. BrickBharat could not inspect a directly accessible copy of the original Equirus document, so all figures remain attributed to the syndicated reports rather than independently confirmed from the underlying tables.
GCCs and flexible offices support demand
Global capability centres were a major office-demand driver. The tracker reportedly places GCC leasing at 19.2 million sq ft, up 22% year on year and equal to 45% of gross office leasing during the measured period. Flexible-workspace operators leased 191,306 seats, 68.4% more than a year earlier, and represented about 20% of office leasing compared with 13% previously. [1]
Net absorption, gross leasing and seats are different measurements. They should not be added together or treated as interchangeable market totals. Absorption broadly concerns occupied space after accounting for space vacated; gross leasing records transaction activity; seat counts describe flexible-workspace capacity.
BrickBharat’s interpretation is that the figures support demand for certain forms of business accommodation, particularly where corporate expansion and flexible occupancy overlap. They do not establish that every office district has the same vacancy or rental conditions. Bengaluru, Hyderabad, Mumbai, Delhi-NCR and other markets can differ substantially by location, building quality and available stock.
Logistics leasing reaches reported record
Leasing in the industrial and logistics segment across eight cities reportedly rose 18% year on year to 36.2 million sq ft in H1 2026. Warehousing accounted for 24.3 million sq ft, or 67% of absorption, while third-party logistics occupiers leased 12.2 million sq ft. [1]
The activity indicates demand for distribution and storage facilities, but it is not a measure of residential construction or retail sales. A logistics lease also does not prove that an asset is fully occupied or achieving a particular investment return. Property-level rent, tenure, capital cost and operating expenditure would be required for that assessment.
Residential inventory moves higher
Against the commercial picture, unsold residential inventory across eight tracked markets rose 4% annually to 525,695 units at H1 2026, according to the report. The quarters-to-sell measure increased from 5.8 at the end of 2025 to 6.0. Ahmedabad had the highest reported inventory overhang at 8.1 quarters, followed by Delhi-NCR at 7.6 quarters. [1]
An unsold home is not necessarily a completed vacant flat: housing-market inventory can include units at different stages of construction. The figure also does not show that prices will fall. Inventory, sales velocity, new launches and asking prices interact differently across cities and budget categories.
For homebuyers, rising inventory can mean more choice in some segments, but it does not remove the need to inspect approvals, construction progress, payment schedules and the developer’s delivery record. For developers and investors, a longer sell-through period can affect cash flow and capital allocation, though the aggregate data cannot quantify the effect on a particular company.
REIT distributions and future luxury launches
The tracker reportedly says India’s listed REIT universe expanded from four trusts to six, with distributions of ₹3,136 crore in Q1 FY27, compared with ₹1,559 crore a year earlier. It also describes close to ₹1 lakh crore of luxury residential launches being planned in Gurugram for H2 FY27. [1]
The word “planned” is material. A launch pipeline is not completed construction, sales revenue or committed buyer demand. Similarly, historic REIT distributions are not a promise of future payouts.
The broader conclusion is that Indian real estate is not moving as one market. Office, flexible workspace, logistics and residential housing respond to different occupiers and financial cycles. The next useful evidence would be H2 absorption, completions, city-level inventory and audited disclosures from listed companies and REITs.
Sources
- The Tribune / ANI — Equirus tracker on commercial demand and residential inventory. Updated 4 October 2026, 12:02 PM IST. Syndicated account; original report not directly inspected.
- Webindia123 / ANI — India’s two-speed real estate trend. Published 4 October 2026, 12:30:38 PM IST. Same syndicated report, used to corroborate publication details rather than as an independent dataset.